Research Christmas 2025: Words and meanings
How recent is recent? Retrospective analysis of suspiciously timeless citations
Alejandro Díez-Vidal, Jose R Arribas
BMJ 2025; 391 doi: https://doi.org/10.1136/bmj-2025-086941 (Published 11 December 2025)Cite this as: BMJ 2025;391:e086941
Abstract
Objective To quantify the time lag between biomedical articles and the studies they describe as “recent,” a term widely used to imply timeliness despite rarely reflecting the actual age of the cited evidence.
Design Retrospective analysis of suspiciously timeless citations based on a structured PubMed search of 20 predefined “recent” expressions.
Sample 1000 English language, full text biomedical articles in which a “recent” expression is directly linked to a citation.
Main outcome measure Time lag in years between citing articles and their referenced “recent” studies.
Results The age of the cited “recent” studies varied widely. The citation lag ranged from 0 to 37 years (mean 5.53 years, median 4 years, interquartile range 2-7). The most frequent lag was one year (n=159, 15.9%), and 177 references (17.7%) were at least 10 years old. Citation patterns varied across medical specialties: critical care, infectious diseases, genetics, immunology, and radiology showed shorter median lags (around two years), while nephrology, veterinary medicine, and dentistry displayed substantially longer lags (ranging from 8.5 to 14 years). Among expressions, “recent approach,” “recent discovery,” and “recent study” were linked to older references, whereas “recent publication” and “recent article” had much fresher citations. The citation lag was similar across world regions and gradually decreased over time, with the most recent publications showing the shortest lags. Journals with high impact factors (≥12) cited more up-to-date work.

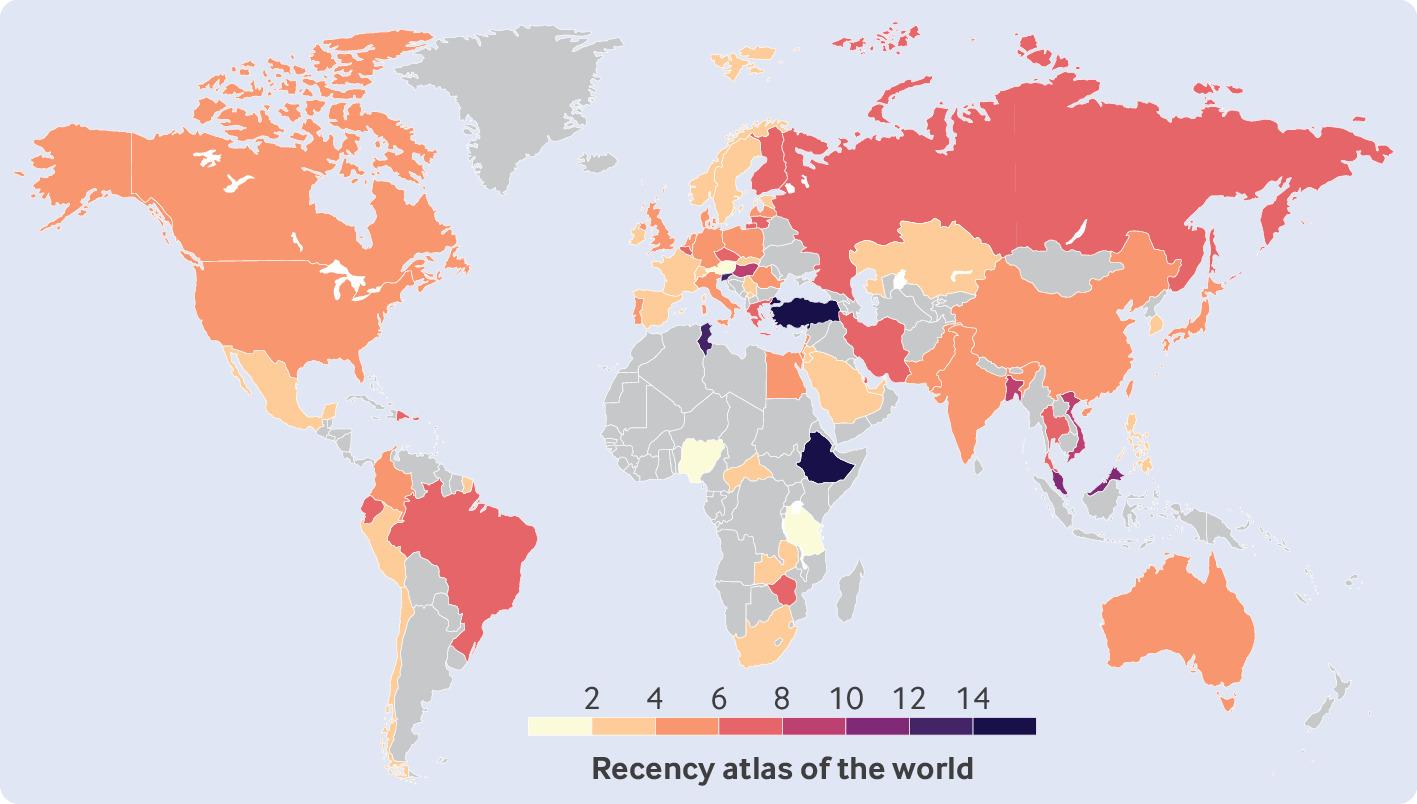
Table 1
Citation lag (years) by medical specialty
| Medical specialty | No of articles (%) | Median citation lag (IQR) | Most frequent citation lag* |
|---|---|---|---|
| Global sample | 1000 (100) | 4 (2-7) | 1 (159) |
| Critical care | 6 (0.6) | 1.5 (1-4.25) | 1 (2) |
| Infectious diseases | 42 (4.2) | 2 (1-4) | 1 (11) |
| Genetics | 21 (2.1) | 2 (1-4) | 1 (8) |
| Immunology | 21 (2.1) | 2 (1-5) | 1 (6) |
| Radiology | 6 (0.6) | 2 (1-12) | 1 (2) |
| Pulmonology | 22 (2.2) | 2.5 (1-3) | 1 (9) |
| Dermatology | 8 (0.8) | 2.5 (0.75-4) | 4 (3) |
| Public health | 89 (8.9) | 3 (2-6) | 2 (16) |
| Cardiology | 59 (5.9) | 3 (2-6) | 2 (13) |
| Microbiology | 23 (2.3) | 3 (1.5-8.5) | 1 (4) |
| Haematology | 19 (1.9) | 3 (2-6.5) | 2 (7) |
| Urology | 7 (0.7) | 3 (2.5-5.5) | 3 (2) |
| Palliative care | 5 (0.5) | 3 (1-3) | 3 (2) |
| Medical humanities | 6 (0.6) | 3.5 (2-7.25) | 2 (2) |
| Oncology | 125 (12.5) | 4 (1-7) | 1 (20) |
| Neurology | 116 (11.6) | 4 (2-8) | 2 (21) |
| Mental health | 60 (6.0) | 4 (2-9) | 1 (9) |
| Endocrinology | 50 (5.0) | 4 (2-6) | 1 (9) |
| Gastroenterology | 37 (3.7) | 4 (3-7) | 2 (8) |
| Pharmacology | 22 (2.2) | 4 (2-7.5) | 2 (5) |
| Rheumatology | 18 (1.8) | 4 (1.25-5.75) | 4 (4) |
| Ophthalmology | 17 (1.7) | 4 (3-7) | 3 (3) |
| General surgery | 9 (0.9) | 4 (3-6) | 3 (3) |
| Medical informatics | 7 (0.7) | 4 (1-6) | 1 (2) |
| Environmental science | 6 (0.6) | 4 (4-4) | 4 (4) |
| Otolaryngology | 5 (0.5) | 4 (2-8) | — |
| Obstetrics and gynaecology | 16 (1.6) | 4.5 (2.75-6.5) | 5 (3) |
| Biomedical engineering | 14 (1.4) | 4.5 (2.25-5) | 5 (4) |
| Anaesthesiology | 10 (1.0) | 4.5 (3-6.5) | 2 (2) |
| Biology | 40 (4.0) | 5 (2-9) | 2 (6) |
| Neurosurgery | 6 (0.6) | 5 (1.25-16.25) | 1 (2) |
| Orthopaedics | 36 (3.6) | 6 (1.75-9) | 1 (8) |
| Chemistry | 5 (0.5) | 6 (1.75-9) | — |
| Paediatrics | 24 (2.4) | 6.5 (3.75-12.75) | 2 (4) |
| Nephrology | 12 (1.2) | 8.5 (3.75-10.5) | 1 (2) |
| Veterinary medicine | 7 (0.7) | 9 (7-17) | 17 (2) |
| Dentistry | 5 (0.5) | 14 (5-17) | — |
Rows are sorted in ascending order based on median lag value. For equal medians, specialties with larger sample sizes appear first. Specialties with fewer than five observations were excluded.
* Citation lag in years (No of occurrences).
Table 2
Citation lag (years) by type of “recent” expression
| “Recent” expression | No of articles (%) | Median citation lag (IQR) | Most frequent citation lag* |
|---|---|---|---|
| Global sample | 1000 (100) | 4 (2-7) | 1 (159) |
| Recent publication | 8 (0.8) | 1 (0-8) | 0 (3) |
| Recent article | 6 (0.6) | 1.5 (0.25-2) | 2 (3) |
| Recent trial | 44 (4.4) | 2 (2-4) | 2 (13) |
| Recent guidelines | 14 (1.4) | 2 (1-4.75) | 0 (3) |
| Recent paper | 12 (1.2) | 2 (1.75-4.25) | 2 (4) |
| Recent result | 7 (0.7) | 2 (1-3) | 1 (3) |
| Recent review | 61 (6.1) | 3 (1-6) | 1 (17) |
| Recent meta-analysis | 51 (5.1) | 3 (1-4) | 3 (12) |
| Recent advancement | 39 (3.9) | 3 (1-6) | 1 (9) |
| Recent analysis | 21 (2.1) | 3 (2-7) | 3 (4) |
| Recent report | 83 (8.3) | 4 (2-6.5) | 1 (16) |
| Recent data | 50 (5.0) | 4 (2-6.75) | 4 (10) |
| Recent finding | 36 (3.6) | 4 (2-6.25) | 2 (8) |
| Recent work | 35 (3.5) | 4 (1-6) | 1 (10) |
| Recent evidence | 58 (5.8) | 4.5 (2-6.75) | 2 (11) |
| Recent development | 8 (0.8) | 4.5 (1.5-7.25) | 0 (2) |
| Recent research | 58 (5.8) | 5 (3-10) | 3 (9) |
| Recent literature | 38 (3.8) | 5 (3.25-12.5) | 5 (7) |
| Recent investigation | 17 (1.7) | 5 (3-6) | 5 (4) |
| Recent study | 280 (28.0) | 5.5 (2-10) | 2 (39) |
| Recent discovery | 8 (0.8) | 7 (5.5-8.25) | 7 (2) |
| Recent approach | 5 (0.5) | 7 (3-7) | 7 (2) |
Rows are sorted in ascending order based on median lag value. For equal medians, expressions with larger sample sizes appear first. Expressions with fewer than five observations were excluded.
* Citation lag in years (No of occurrences).
Table 3
Citation lag (years) by world region of first author (World Bank classification)
| World region | No of articles (%) | Median citation lag (IQR) | Most frequent citation lag* |
|---|---|---|---|
| Global sample | 1000 (100) | 4 (2-7) | 1 (159) |
| Sub-Saharan Africa | 17 (1.7) | 3 (2-6) | 2 (3) |
| Europe and Central Asia | 332 (33.2) | 4 (2-7) | 1 (56) |
| North America | 310 (31.0) | 4 (2-7.75) | 1 (56) |
| East Asia and Pacific | 246 (24.6) | 4 (2-8) | 2 (39) |
| Middle East and North Africa | 36 (3.6) | 5 (2-10) | 1 (5) |
| South Asia | 33 (3.3) | 5 (3-7) | 4 (6) |
| Latin America and the Caribbean | 26 (2.6) | 5 (2.25-8) | 3 (4) |
Rows are sorted in ascending order based on median lag value. For equal medians, regions with larger sample sizes appear first.
* Citation lag in years (No of occurrences).
Table 4
Citation lag (years) by journal impact factor
| Impact factor | No of articles (%) | Median citation lag (IQR) | Most frequent citation lag* |
|---|---|---|---|
| Global sample | 1000 (100) | 4 (2-7) | 1 (159) |
| Impact factor | |||
| <3 | 438 (43.8) | 4 (2-8) | 1 (82) |
| 3-6 | 337 (33.7) | 4 (2-7) | 2 (45) |
| 6-12 | 140 (14.0) | 4 (2-8) | 2 (21) |
| ≥12 | 85 (8.5) | 3 (1-5) | 1 (18) |
* Citation lag in years (No of occurrences).
Table 5
Citation lag (years) by publication year of citing article
| Publication year | No of articles (%) | Median citation lag (IQR) | Most frequent citation lag* |
|---|---|---|---|
| Global sample | 1000 (100) | 4 (2-7) | 1 (159) |
| 1980-1990 | 27 (2.7) | 7.5 (6.0-10.5) | 6 (5) |
| 1990-2000 | 69 (6.9) | 6.25 (4.5-8.5) | 4 (12) |
| 2000-2010 | 142 (14.2) | 5.0 (3.5-7.25) | 5 (23) |
| 2010-2020 | 361 (36.1) | 4.0 (2.0-6.5) | 3 (62) |
| 2020-2025 | 401 (40.1) | 2.5 (1.5-6.0) | 1 (117) |
* Citation lag in years (No of occurrences).
Conclusions This playful analysis suggests that “recent” is applied with striking elasticity across biomedical literature. While some authors cite genuinely recent work, others stretch the definition to decades. Readers and reviewers should take “recent” claims with a grain of chronological salt.