CLINICAL INVESTIGATION
Targeted Tissue Perfusion Versus Macrocirculatory-Guided Standard Care in Patients With Septic Shock: A Randomized Clinical Trial—The TARTARE-2S Trial
Pettilä, Ville; Pfortmüller, Carmen A; Perner, Anders; et al
Critical Care Medicine 54(1):p 24-34, January 2026. | DOI: 10.1097/CCM.0000000000006899
Abstract
Objectives:
To determine whether treatment targeting improving tissue perfusion while allowing lower than recommended blood pressure (targeted tissue perfusion [TTP]) improves outcome compared with mean arterial pressure (MAP)-guided standard care (SC).
Design:
A randomized, parallel-group, open-label clinical trial with 30-day follow-up. Allocation was stratified according to trial site and presence of chronic arterial hypertension.
Setting:
Three European university hospital ICUs with enrollment from 2016 to 2022.
Patients:
Two hundred nineteen patients with septic shock and blood lactate greater than 3 mmol/L allocated to TTP (n = 111) vs. SC (n = 108).
Interventions:
The TTP protocol comprised capillary refill time, peripheral skin temperature, arterial lactate concentrations, and MAP 50–65 mm Hg. The SC protocol comprised the hemodynamic targets of 2012 Surviving Sepsis Campaign.
Measurements and Main Results:
Ninety-seven (87.4%) in TTP and 97 (89.8%) in SC group (total n = 194) were analyzed for the primary outcome. The median (interquartile range) of days alive in 30 days with normal lactate and without vasopressor/inotropic drugs (primary outcome) was 23 (10–27) in TTP group and 22 (1–27) in SC group (difference in medians, 0.59; 95% CI, –3 to 4). Secondary outcomes (single components of the primary outcome, days alive without organ support and mortality, all at 30 d) and serious adverse reactions were not significantly different between intervention groups. At day 30, 24 patients (24.7%) in TTP group vs. 27 patients (27.8%) in SC group had died. MAP levels were lower in the TTP group vs. the SC group.
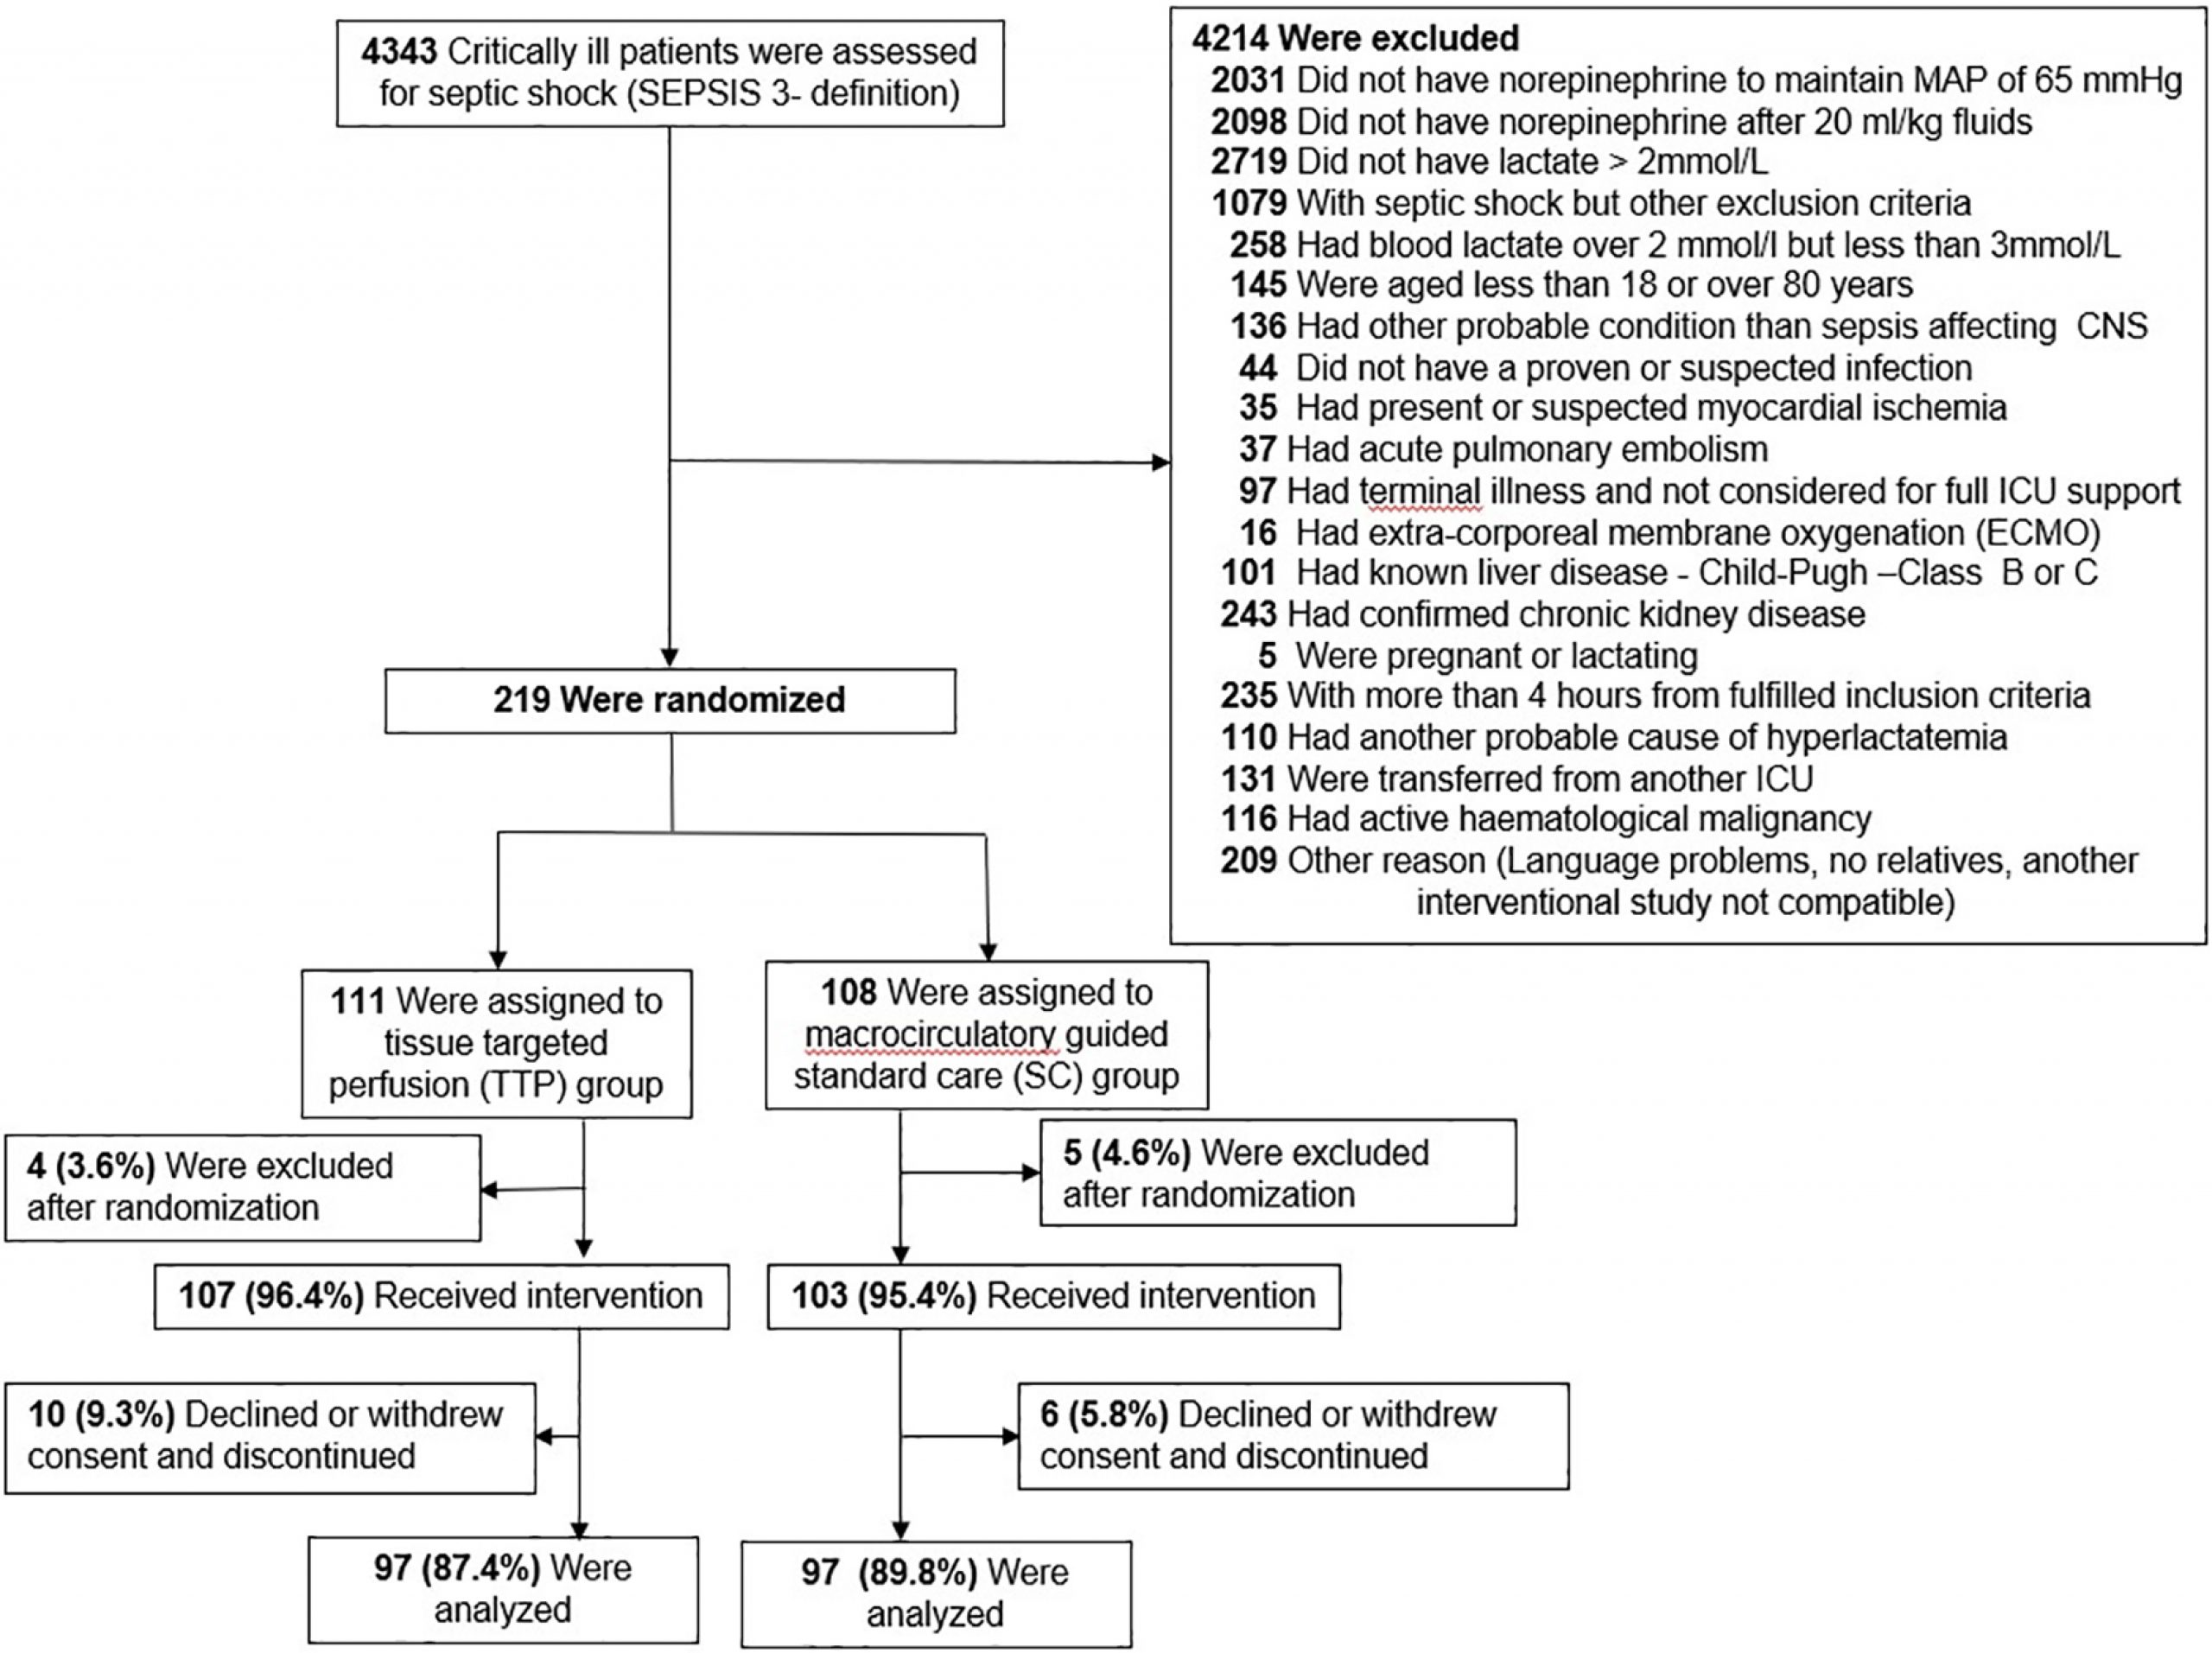
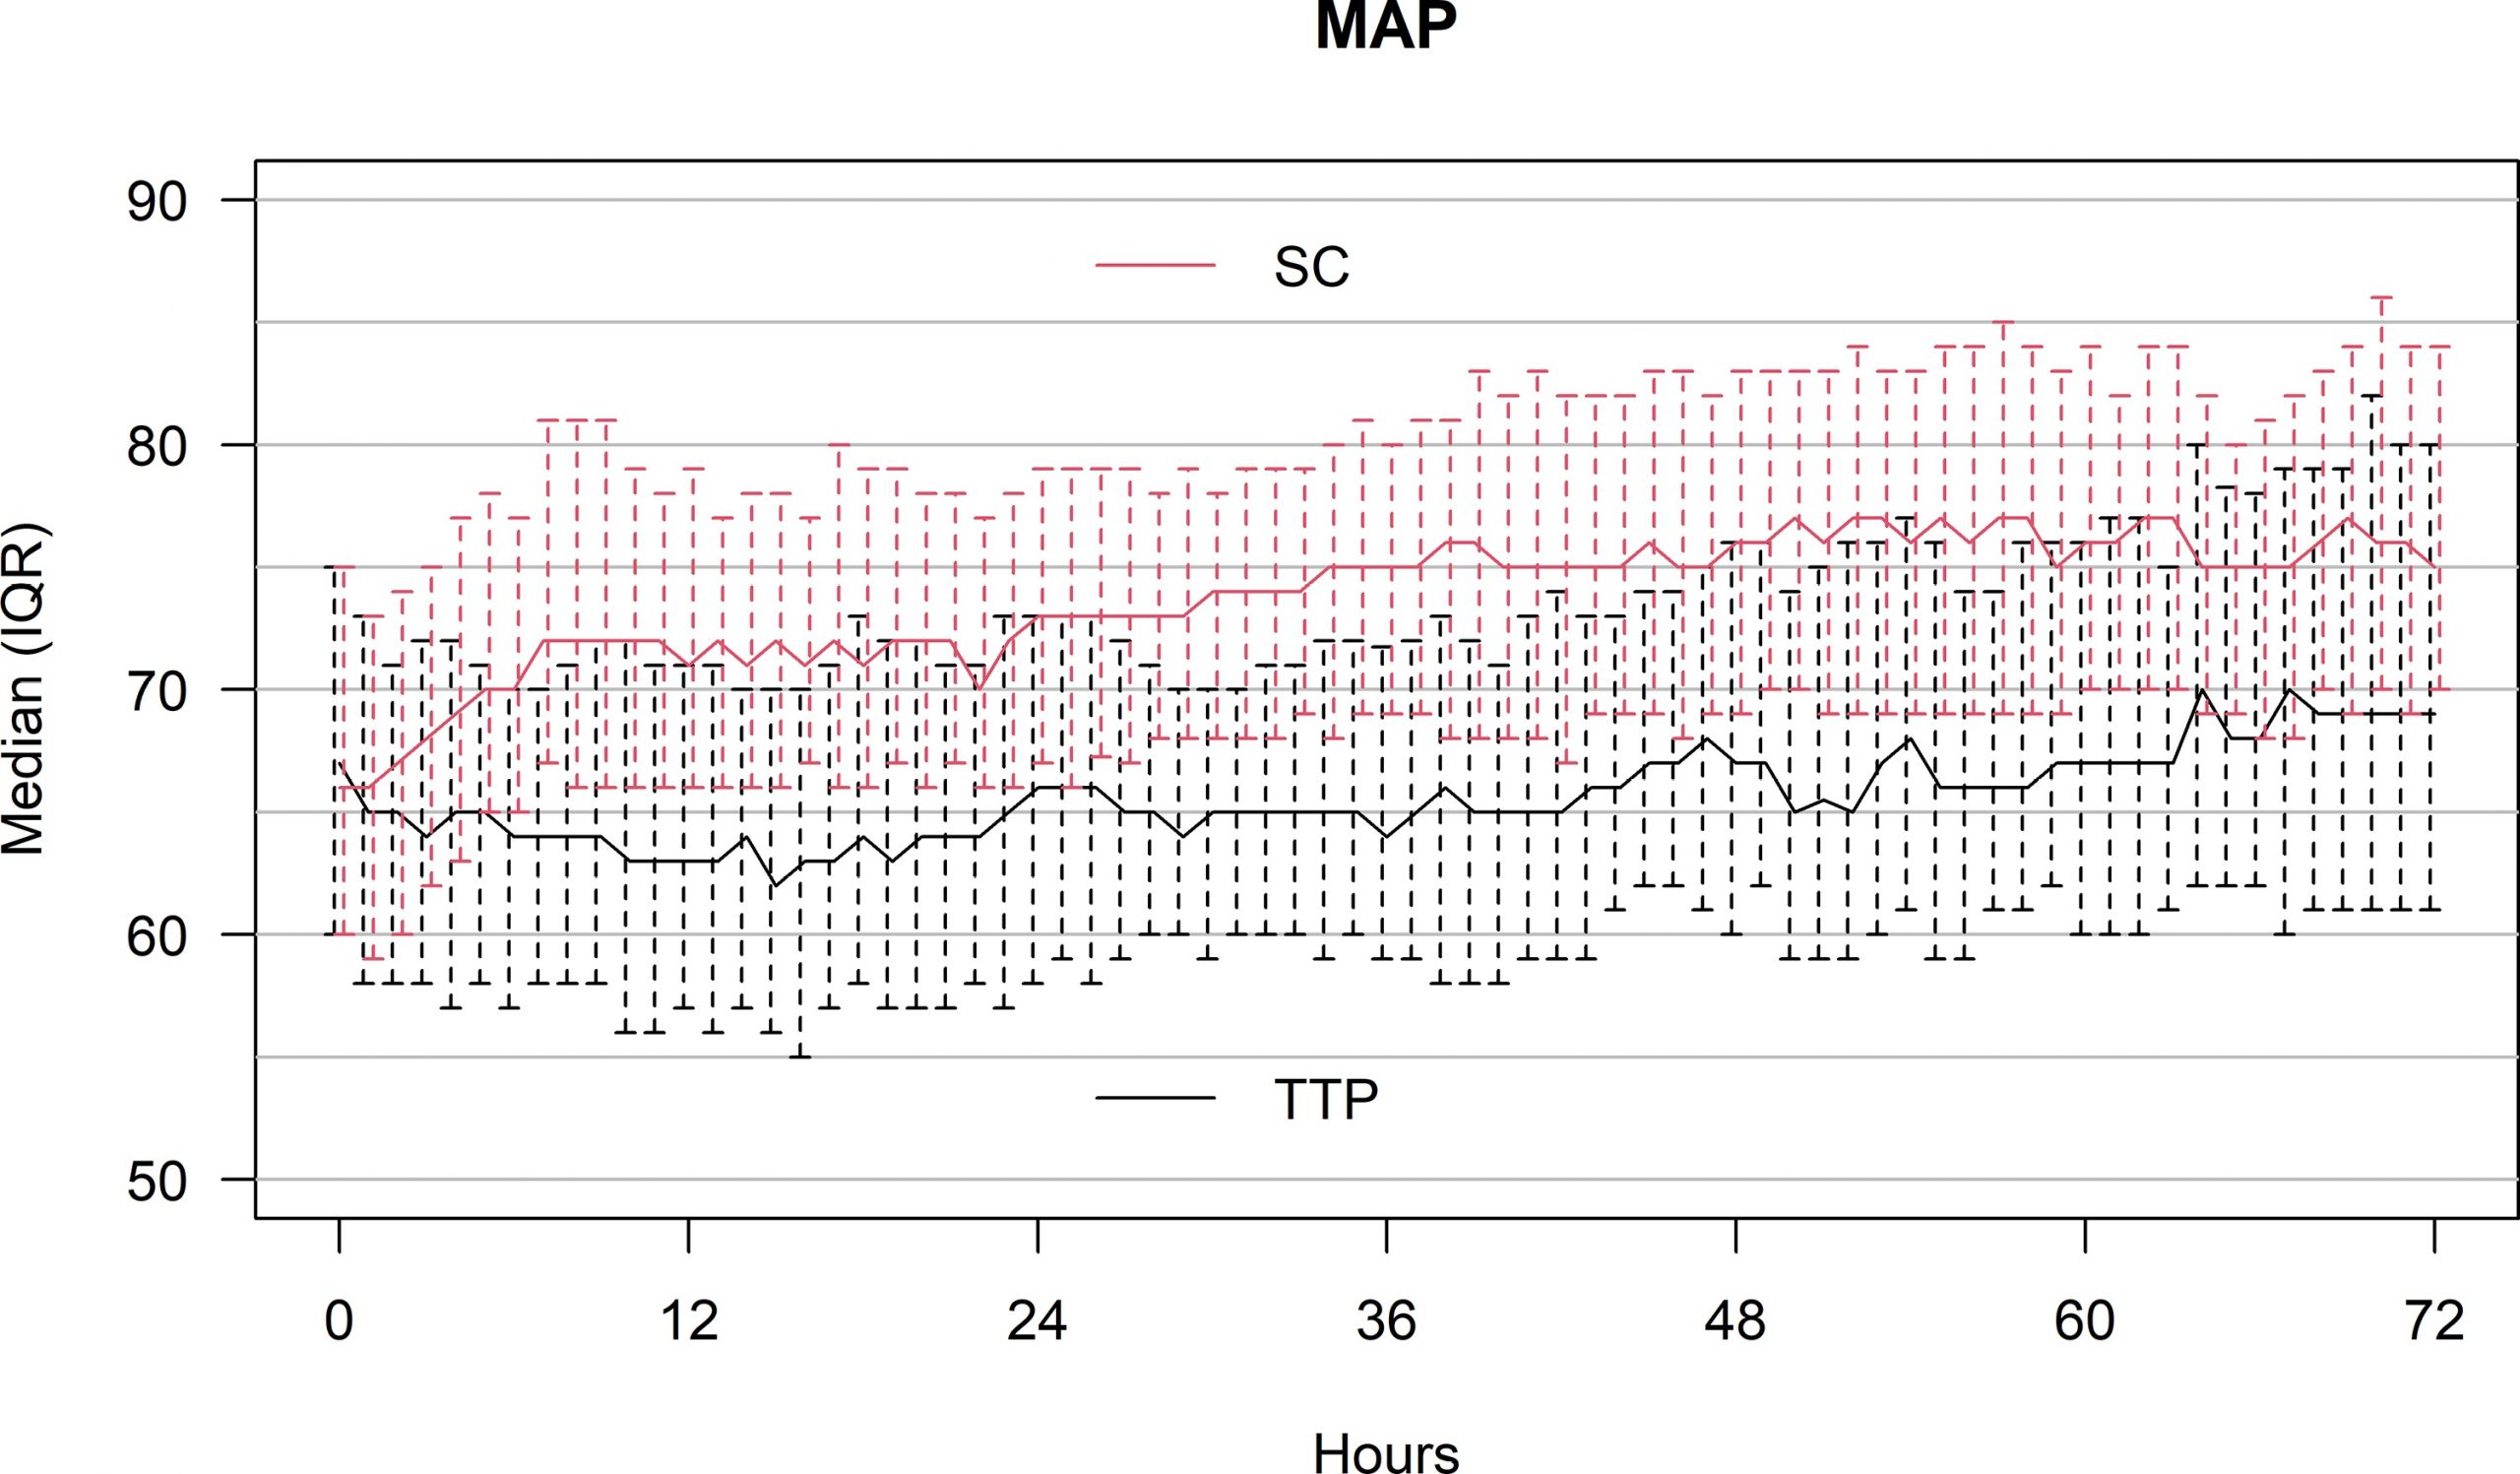
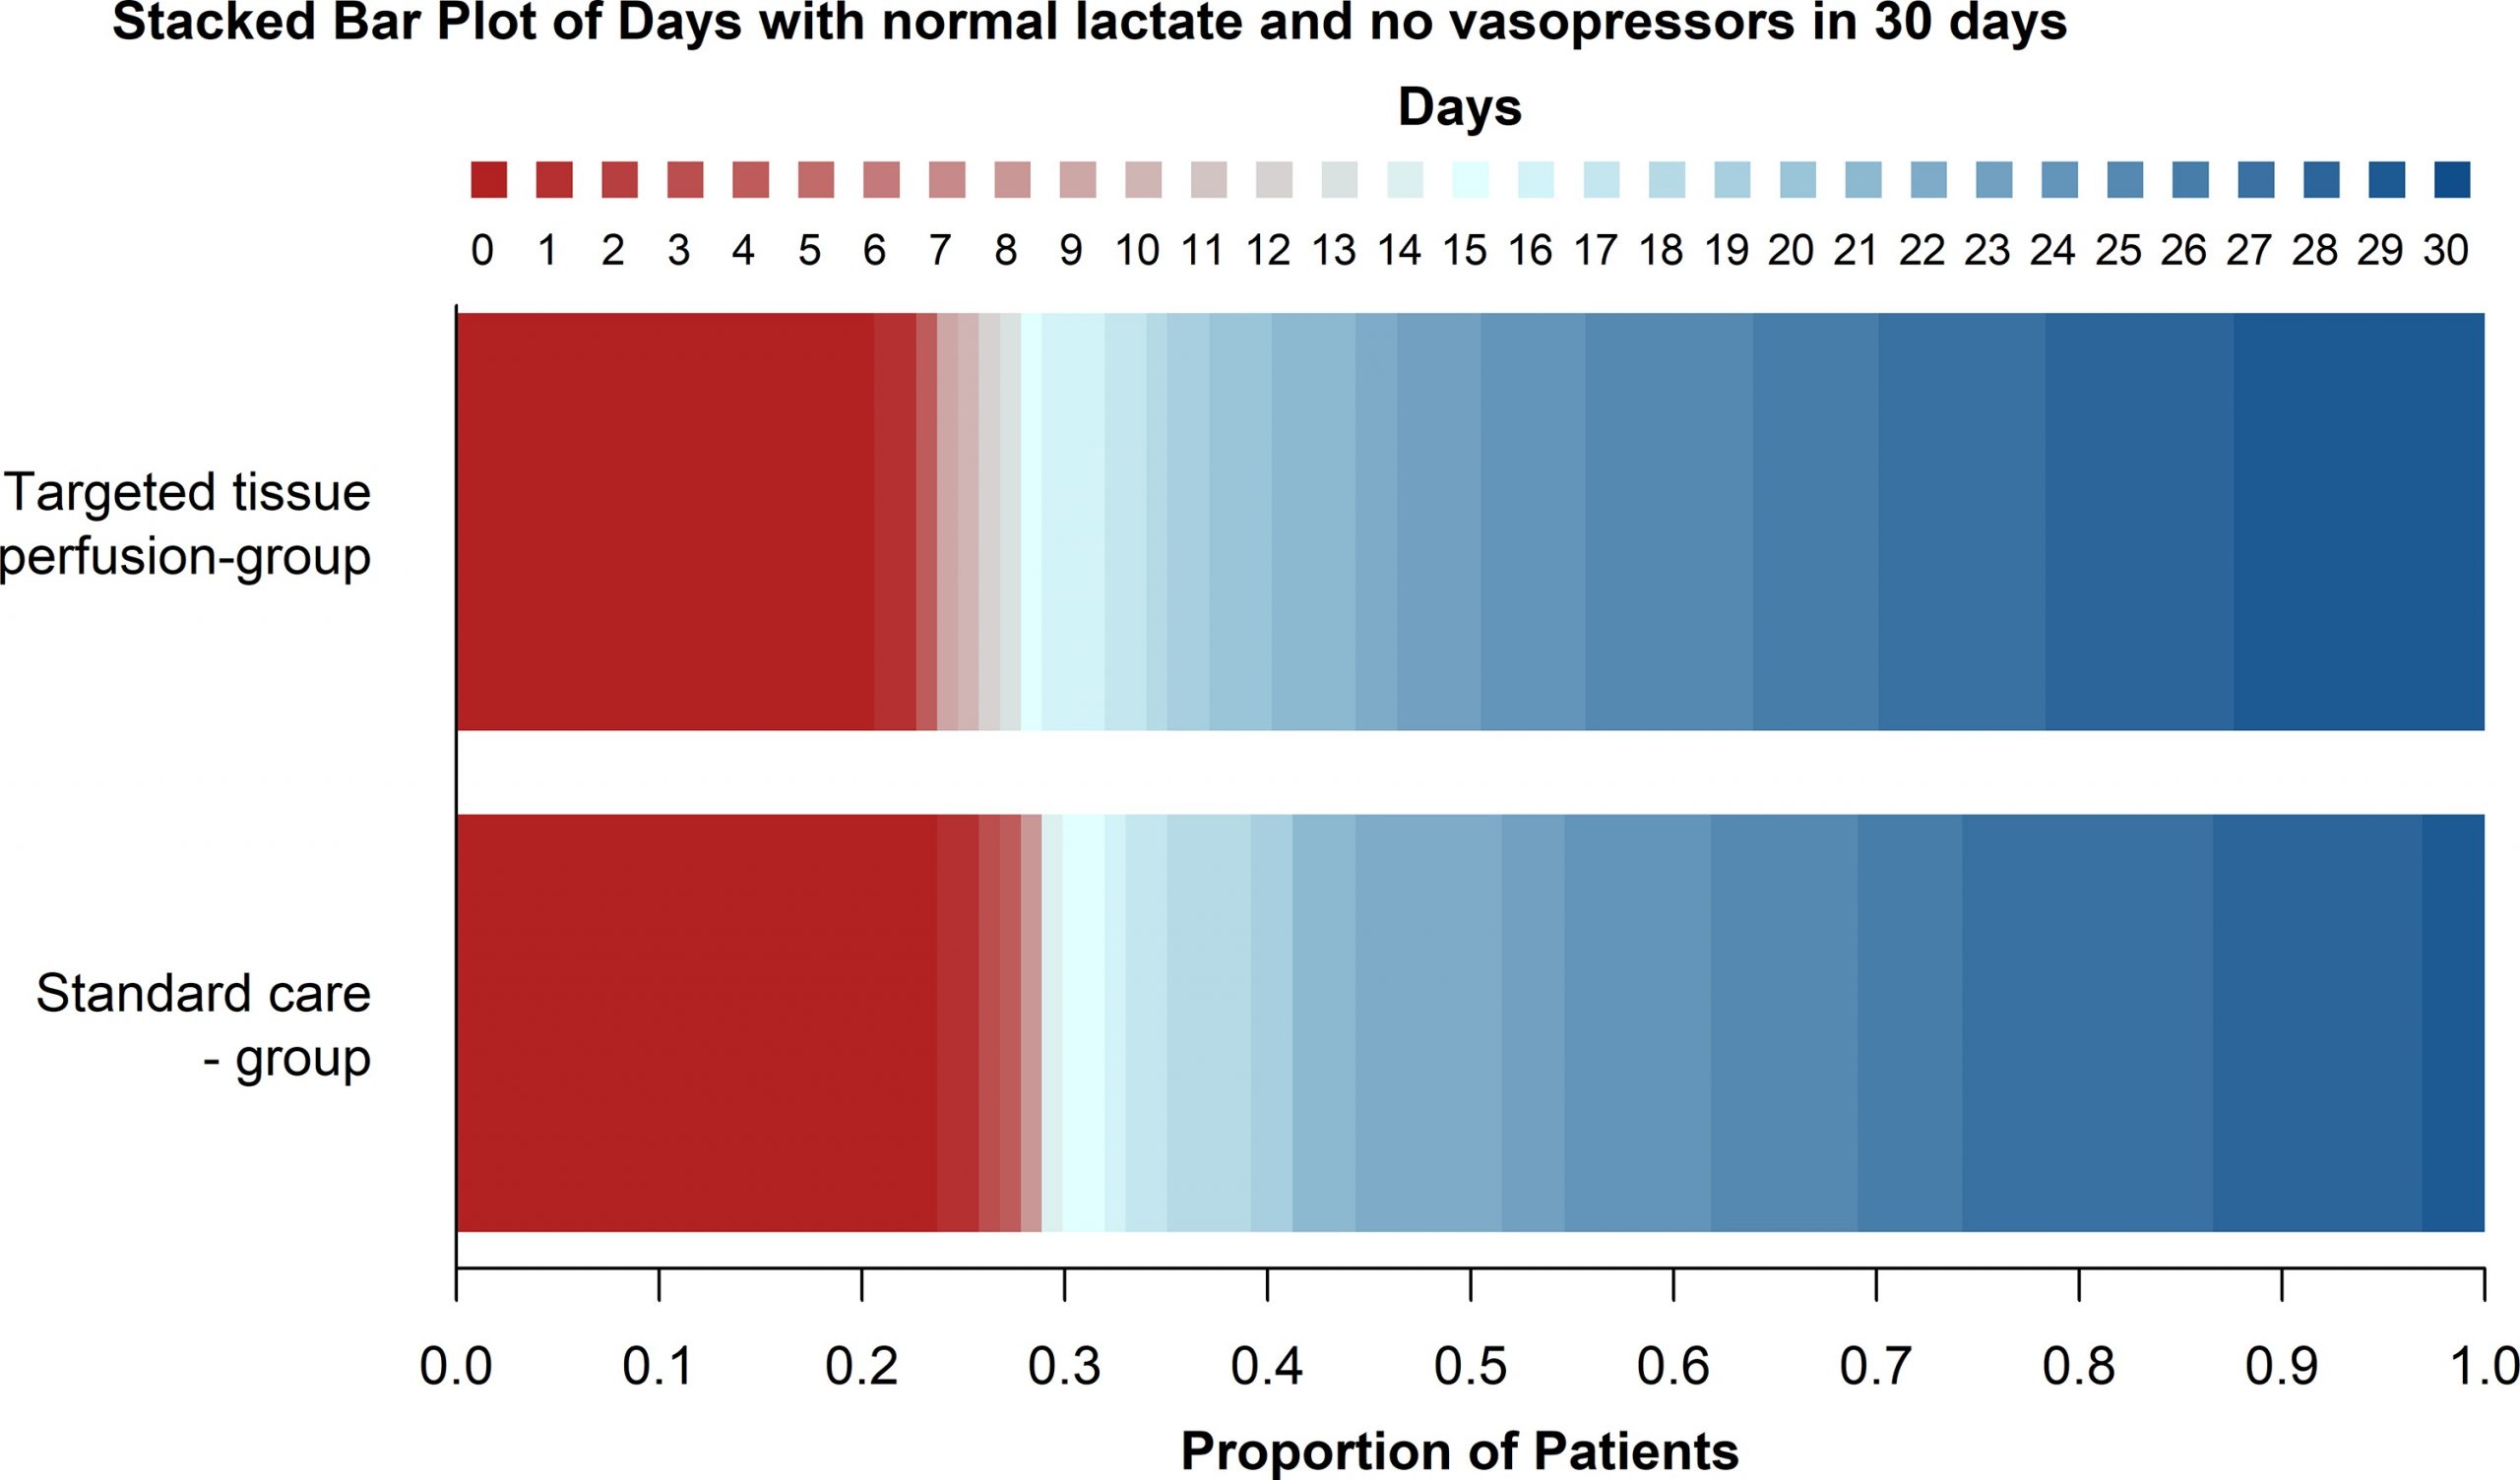
TABLE 1. - Patient and Treatment Characteristics at Baseline
| Demographics, Diagnoses, Laboratory Values, and Baseline Treatment | Targeted Tissue Perfusion Group (n = 97) | Standard Care Group (n = 97) |
|---|---|---|
| Age, mean (sd), yr | 62 (14) | 62 (12) |
| Number of patients, n (%) | ||
| Men | 45 (46) | 36 (38) |
| Women | 52 (54) | 60 (62) |
| Body mass index, mean (sd), kg/m2 | 27 (7.8) | 28 (6.2) |
| Concomitant disease, n (%) | ||
| Hypertension | 37 (38) | 41 (42) |
| Chronic heart failure | 7 (7) | 10 (10) |
| Previous myocardial infarction | 4 (4) | 8 (8) |
| Previous stroke | 5 (5) | 6 (6) |
| Chronic obstructive pulmonary disease | 8 (8) | 10 (10) |
| Diabetes | 21 (22) | 18 (19) |
| Hematological malignancy | 3 (3) | 2 (2) |
| Metastatic cancer | 6 (6) | 7 (7) |
| Suspected or proven site of infection, n (%) | ||
| Pulmonary | 18 (19) | 23 (24) |
| Abdominal | 30 (31) | 29 (30) |
| Urinary | 1 (1) | 2 (2) |
| Soft tissue | 13 (13) | 11 (11) |
| Other, including unknown | 34 (35) | 31 (32) |
| Baseline values, mean (sd) | ||
| Creatinine, µmol/L, n = 105a | 81 (21) | 81 (26) |
| Lactate, mmol/L | 6.2 (3.2) | 5.6 (2.8) |
| Hemoglobin, g/L | 116 (20) | 111 (26) |
| Mean arterial pressure | 65 (9) | 66 (10) |
| Treatment at randomization, n (%) | ||
| Mechanical ventilationa | 59 (61) | 71 (73) |
| Renal replacement therapya | 21 (21.6) | 23 (23.7) |
| Norepinephrine dose, μg/kg/min | 0.2 (0.2) | 0.2 (0.2) |
| Use of inotropic agentsa | 45 (46.4) | 42 (43.3) |
| Fluid volume given—the last 2 hr, mL, mean (sd) | 1100 (1033) | 1129 (1061) |
| Simplified Acute Physiology Score II score, mean (sd) | 57 (17) | 55 (17) |
| Sequential Organ Failure Assessment score, mean (sd) | 8.9 (2.5) | 8.6 (2.4) |
TABLE 2. - Primary Composite Outcomes and Secondary Outcomes
| Outcomes | Targeted Tissue Perfusion Group (n = 97) | Standard Care Group (n = 97) | Difference in Medians/Proportions (95% CI) | p |
|---|---|---|---|---|
| Primary outcome | ||||
| Days alive in 30 d with normal lactate and without vasopressor or inotropic agents, d, median (IQR) | 23 (10–27) | 22 (1–27) | 0.59 (–3 to 4) | 0.418 |
| Secondary outcomes | ||||
| Days alive in 30 d, median (IQR) | 30 (30–30) | 30 (16–30) | 1.12 (0.59–2.12)b | 0.740a |
| Deaths at day 30, count (%) | 24 (24.7) | 27 (27.8) | –3.1 (–16.5 to 10.3) | 0.745 |
| Time to normal lactate, d, median (IQR) | 2 (0–6) | 2 (0–5) | 0.15 (–2 to 2) | 0.917 |
| Days alive with normal lactate in 30 d, median (IQR) | 25 (15–29) | 25 (8–29) | 0.37 (–2 to 4) | 0.597 |
| Time to no vasopressor or inotropic agents, d, median (IQR) | 3 (1–5) | 3 (2–6) | –0.46 (–2 to 0) | 0.211 |
| Time to normal lactate and no vasopressor or inotropic agents, median (IQR) | 4 (2–9) | 5 (2–8) | –0.44 (–2 to 1) | 0.553 |
| Days alive in 30 d without vasopressor or inotropic agents, median (IQR) | 26 (13–28) | 24 (3–27) | 1.03 (–2 to 3) | 0.239 |
| Days alive without RRT in 30 d, median (IQR) | 30 (15–30) | 30 (14–30) | –0.23 (–6 to 5) | 0.920 |
| Days alive without MV in 30 d, median (IQR) | 25 (11–28) | 24 (4–28) | 0.37 (–3 to 3) | 0.626 |
| Days alive without any organ support (RRT, MV) in 30 d, median (IQR) | 24 (8–28) | 24 (4–28) | 0.06 (–4 to 4) | 0.959 |
| AKI, n (%) | 78 (80) | 69 (71) | 9.3 (–3.7 to 22.2)c | 0.180 |
| AKI with RRT, n (%) | 35 (36) | 31 (32) | 4.1 (–10.2 to 18.5)c | 0.650 |
| Total amount of norepinephrine given in 96 hr, µg/kg, n (%) | 766 (819) | 947 (1061) | 12.2 (–293 to 295) | 0.340 |
aAdjusted by site and hypertension.
bCompeting risk analysis, difference as hazard ratio adjusted by site and hypertension.
cDifference in risk (95% CI).
Conclusions:
In ICU patients with septic shock and lactate greater than 3 mmol/L, targeting tissue perfusion and allowing lower than recommended MAP did not increase the number of days alive with normal lactate and without vasopressor/inotropic drugs at 30 days. No additional safety concerns with the TTP strategy were detected compared with SC.
